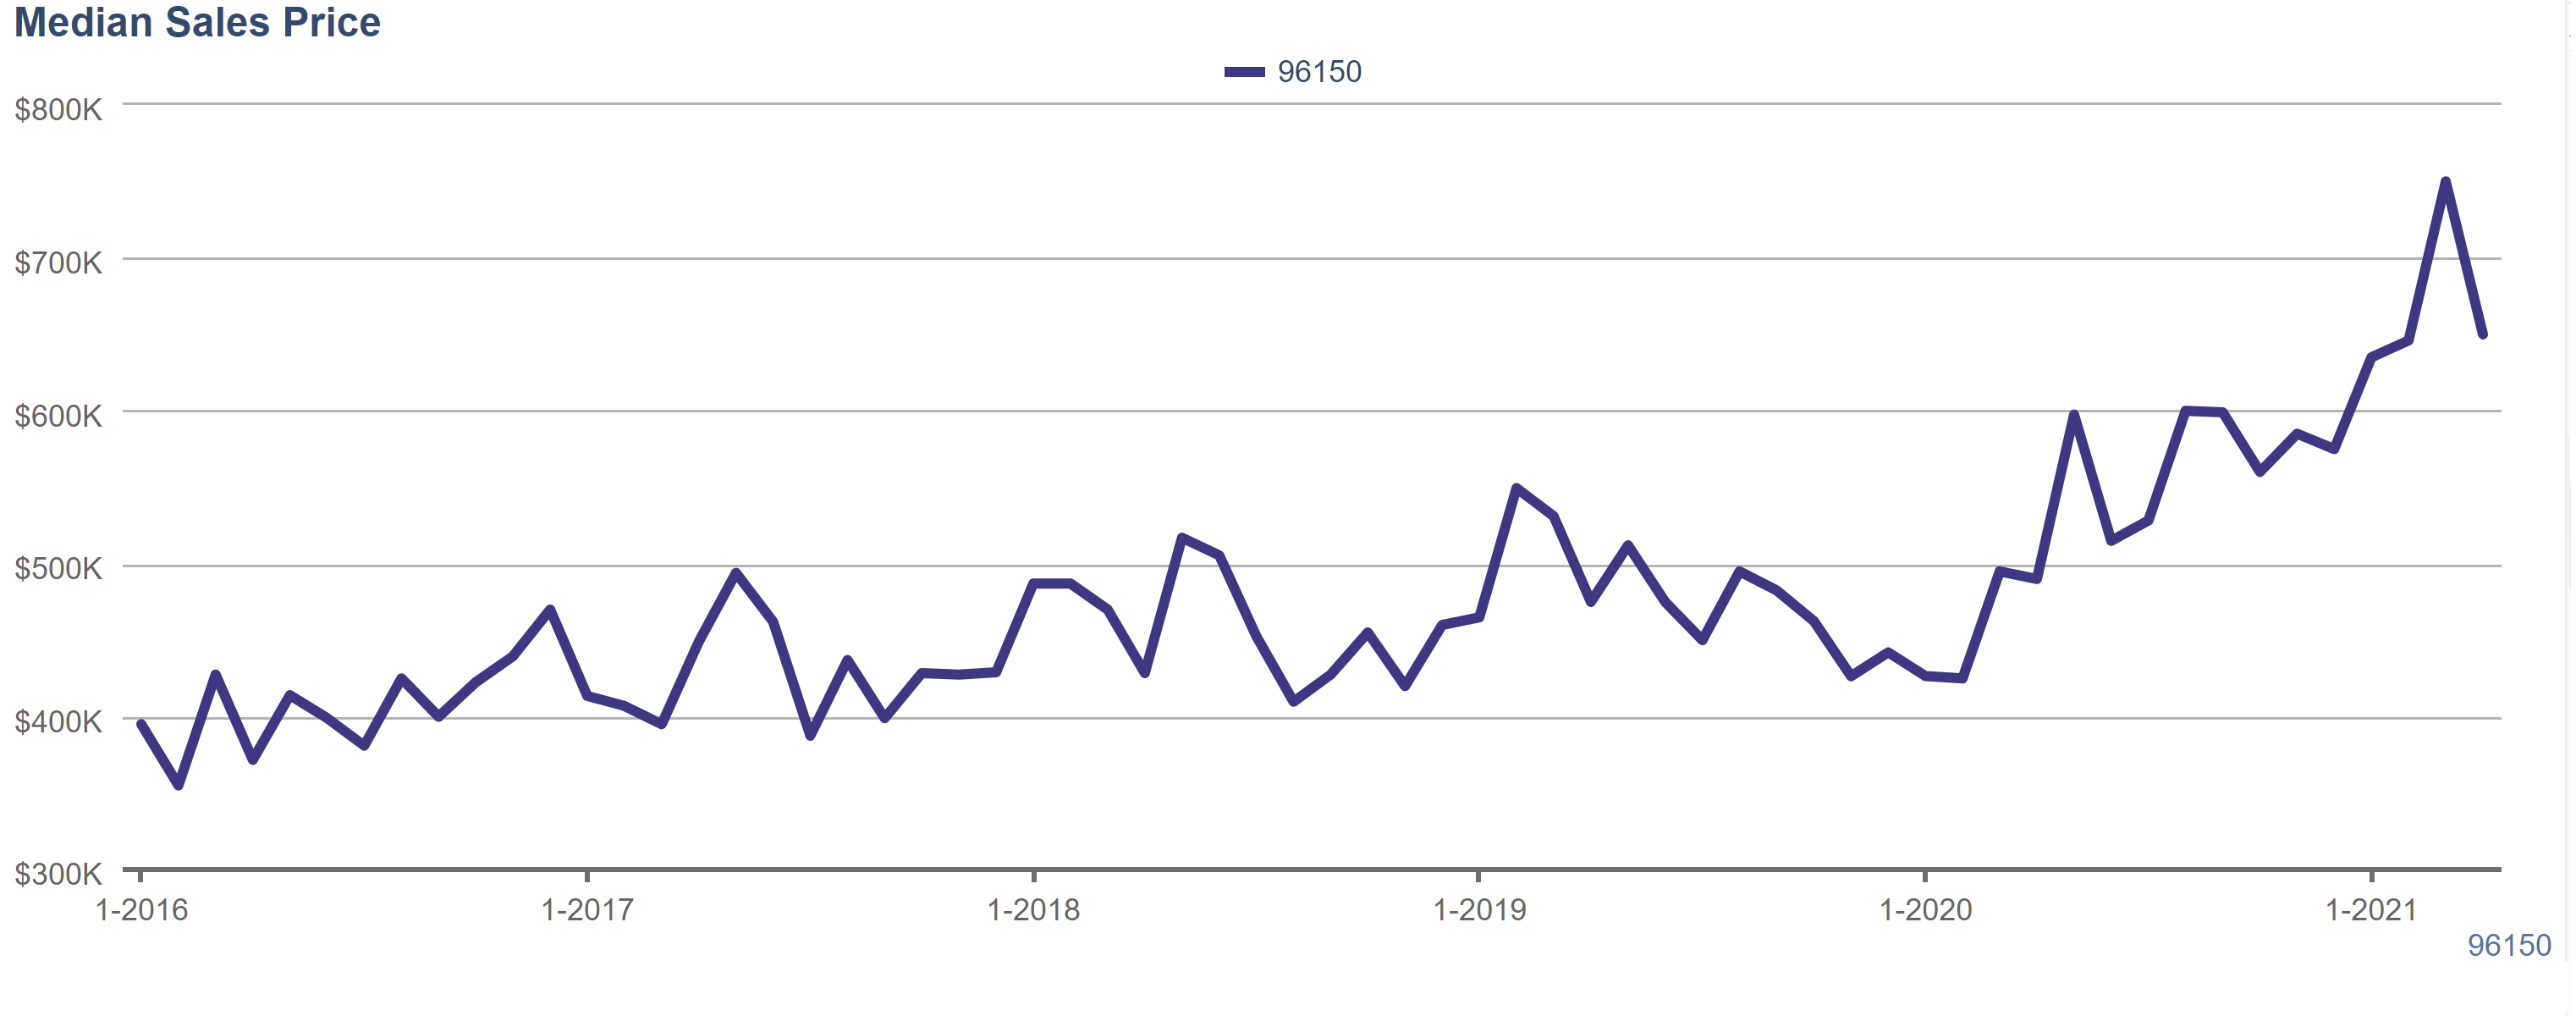
We know some people love graphs and numbers. They want to see data, and lots of it. This page is for those kind of folks. For those who want a hand in understanding these graphs and what they mean for the real estate market in Tahoe, check out our page Lake Tahoe Real Estate Market Details.
The graphs below include all single family properties in South Lake Tahoe, CA including homes and condos/townhomes. The south shore has the largest number of sales at the lake which means it gives you the most accurate picture of what’s going on with the real estate market at the lake.
We love data too! For more detailed and targeted data, or to get a professional explanation of what this data means, contact OUR TEAM. We would love to go into tons of detail with you to show how the current market affects your plans to purchase or sell in Lake Tahoe.
(The graphs are updated at the beginning of each month and go back 5 years. They are based on month-to-month data without any data points being excluded. This means it is possible a super high or low sale could skew the data for that month.)
Keep up to date on Tahoe Real Estate
- Sign up for an email notification so you’ll know the minute Tahoe properties are listed.
- Call us directly at 530-541-2465 and we’ll go over all your options.
- Search all homes for sale around the lake. Our website makes it easy to search for homes that match your criteria.
- Get a FREE custom market evaluation for your home.
